Raytracer
Can AI find a way to project a 3D image?
Project maintained by brywalker1 Hosted on GitHub Pages — Theme by mattgraham
Overview
Using ray tracing and artificial intelligence to make floating, 3D images
(For those not in our AI class: "Ray tracers in Matlab and Python", [coming soon])
Holograms vs. 3D images
A hologram is a photograph you can see from several angles. When illuminated correctly, you can move to a new position and see the image from a different angle. 3D images include holographic sheets, but they also include things like an image floating in fog or Star War's "Help me Obi Wan" scene. The goal of this project is to create a device that will create similar, animated 3D images.
Today, there are a lot of ways to create 3D images, like holographic plates, 3D Glasses, Heads up displays, spinning mirrors, fog projections, and laser shows. There are also other interesting low tech optical illusions out there, like Pepper's Ghost, and mirascopes.
Concept
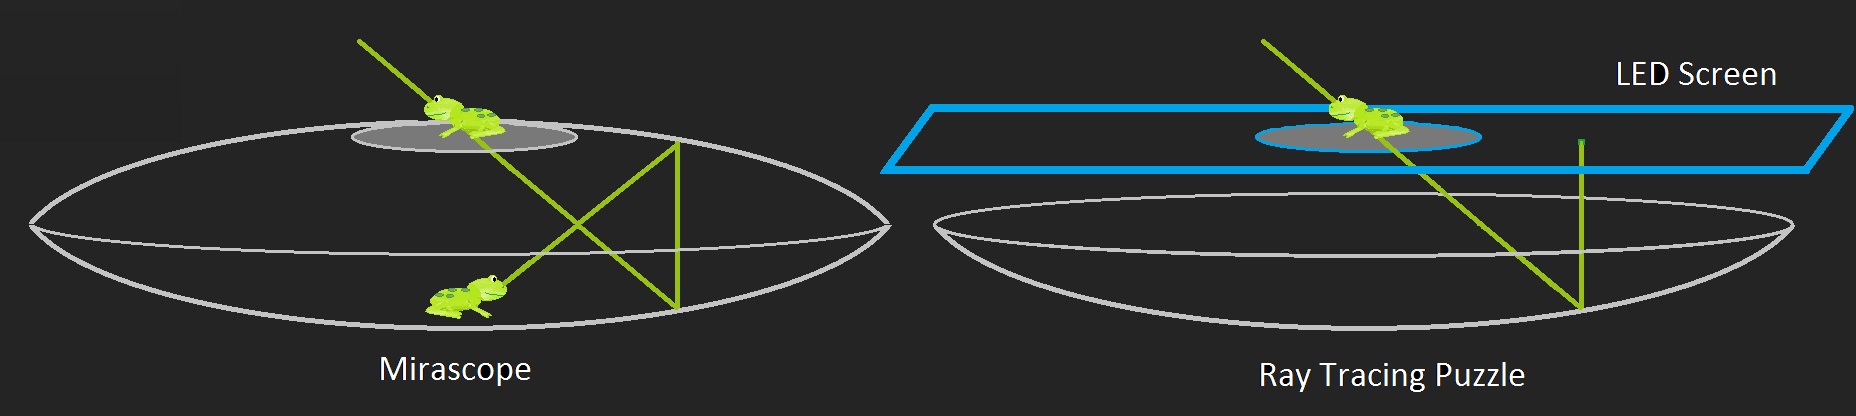
My idea is based on a mirascope.

To see how they work, click here!
I want to replace the top mirror and the object with an LED screen--allowing for animated, interactive objects. The problem? A real mirascope reflects several different rays of light (different angles, different colors) off of one point in the upper mirror. An LED screen has one pixel producing one color at any given point. This means we'll have to approximate the correct image, mapping the most important parts of the 3D image to position and direction information on our 2D screen. How do we determine the best mapping? Enter artificial intelligence.
Hill Climbing AI
One of the most basic forms of artificial intelligence is called hill climbing. In hill climbing, AI finds a solution, scores it according to some metric, and then tries to find a better one. After doing this for several days, weeks, or even months, it finds a 'good' solution (although not necessarily the 'best' solution) based on the scoring metric used.
Scoring
There are two important 'scores' for creating 3D images:
- Each point in your image needs to be visible from several directions
- There need to be a lot of points to make an image
The tool used for scoring a particular mapping is a set of unit vectors, distributed around a sphere. We will call them sphere vectors. They represent possible viewing angles for a given point in space.
Scoring Algorithm:
- For each point in space, determine which light rays passed through it
- For each sphere vector
- Take the dot product of each light ray at the point in space with the sphere vector
- Save the largest resulting value.
- This value represents the light ray closest to the sphere vector's direction
- For each sphere vector
- Sum the largest results for each sphere vector at each point in space. This is your score.
This scoring metric has three important results:
- As light rays move to cover more viewing angles, your score increases
- As light rays move to cover more points, your score increases
- If two rays travel in the same direction from the same point, your score does NOT increase. Because the algorithm stored only the highest value, the second ray is not scored and can be used at a different point.
Results
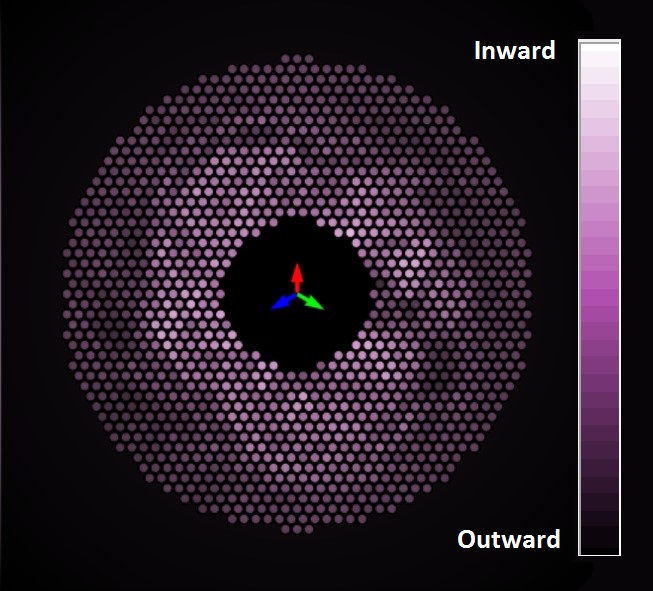
Here is a display of what I have running so far: This screen replaces the upper screen of the mirascope, and the colors represent directions the LEDs are pointing. Black means the LED is pointing into the monitor. More red means the LEDs are pointing upward. For reference, the Key is in the center of the diagram.

Here's another way of viewing the data. We noticed while creating the video above that the central region tended to point inwards. In this graph, the light purple regions are pointing inwards, and the near black region is pointing outwards. You can see the the central region is largely pointing inwards.
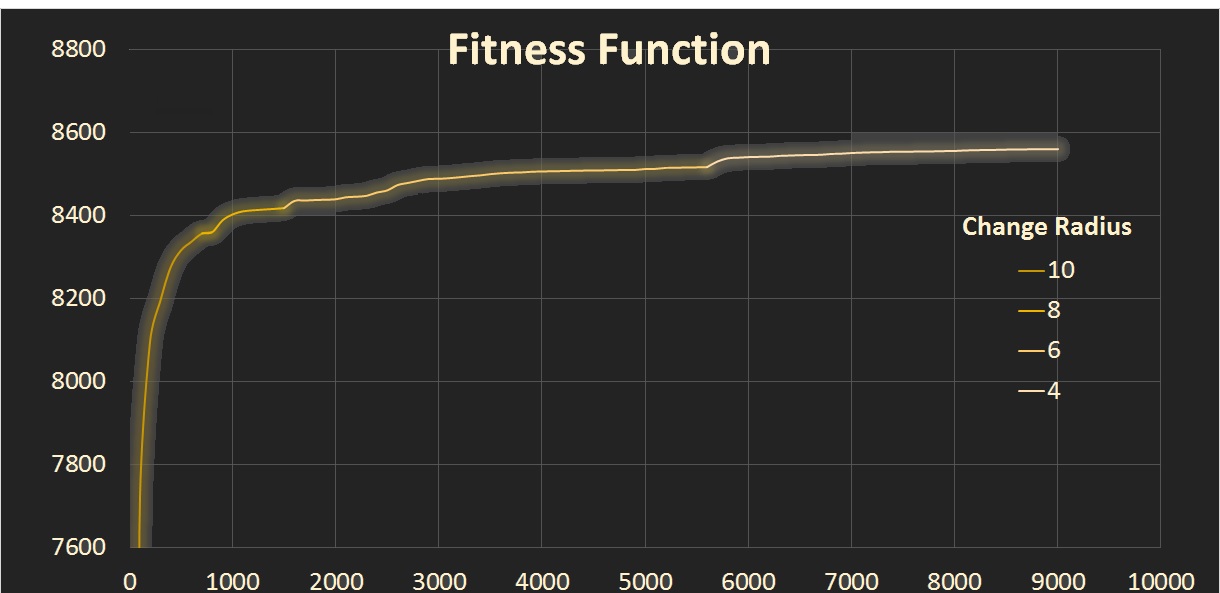
Another bit of good news: the software is still running, 1 month later, but it continues to make progress. Below is a graph of the scoring or fitness function over time. The Vertical axis represents the score, the Horizontal axis represents the number of iterations the hill climber has gone through.